
New tutorial: Running complex analytics on documents using Aryn and Sycamore
July 13, 2025
While GenAI-powered applications have made significant progress in dealing with unstructured data, most of them still struggle to automatically handle complexity and scale. For example, several of our customers perform financial services research on thousands of complicated documents, each with unique formatting and a mix of tables and text. The questions they ask are also complex, and answering them requires finding and synthesizing information across many documents.
For example, consider a financial analyst who is performing research on publicly traded companies and wants to get a detailed understanding of how inflation has impacted earnings. They might have a question like: “In the past 5 years, which companies mentioned inflation the most in their earnings calls and how many times did each company mention inflation?”
Today, the most common approaches to deal with unstructured data would fail to reliably answer these types of questions. Simply uploading the text of all earnings calls over the past 5 years to an LLM would not work due to context window limitations. Performing RAG wouldn’t work either, because answering the question requires counting and sorting the data — something the RAG-style pattern doesn’t allow for.
Learn how to run analytics on documents
Instead, Aryn takes a different approach. We run actual analytics, and enable users to ask questions on unstructured data that require more complex analysis. Analytics uses multi-step query plans with LLMs and database-style operators to break apart queries and answer them at scale. This is the backbone of the Deep Analytics engine in our product.
In this tutorial series, we’ll introduce you to use our open source Sycamore library to run ETL and analytics on documents, and show you how to use Sycamore with Aryn’s DocSet storage to create and run analytics workflows. We’ll also show you how running analytics surpasses what a RAG-style query can answer.
We’ve structured the tutorial in a series of Google Colab notebooks that run through exploring and querying a set of earnings call transcripts.
Tutorial sections:
- Part 1: Preparing documents for analytics (notebook)
- Part 2: Running RAG pipelines and exploring RAG limitations (notebook)
- Part 3: Running analytics on documents (notebook)
You’ll need an Aryn API key and OpenAI key, and the tutorial will run ~$10 of OpenAI cost. The tutorials will instruct you on how to get API keys, if you don’t have them already.
However, if you want a quicker taste of our style of analytics before diving in (and no OpenAI needed!), continue on with this blog post first. By the end of it, you’ll be able to write a query that answers the question “In 2024 which companies mentioned inflation the most in their earnings calls and how many times did each company mention inflation?” with the following answer:
inflation_mentions
┏━━━━━━━━━━━━━━━━━━━━━━━━━━━━━━━━┳━━━━━━━━━━┓
┃ company                        ┃ mentions ┃
┡━━━━━━━━━━━━━━━━━━━━━━━━━━━━━━━━╇━━━━━━━━━━┩
│ Camden Property Trust          │ 1        │
│ Netflix                        │ 1        │
│ Tesla                          │ 1        │
│ Teva Pharmaceutical Industries │ 1        │
│ Intel                          │ 2        │
│ AstraZeneca Plc                │ 3        │
│ Nvidia                         │ 3        │
│ Amazon.com                     │ 4        │
└────────────────────────────────┴──────────┘
The earnings call transcript dataset
Let’s first familiarize ourselves with the dataset, which is a set of quarterly earnings call transcripts from public companies. Analyzing these conversations is a common practice in the investing world, as analysts often look for important clues/details in these calls to help them guide their investment decisions. The following is an example of a transcript of an earnings call.
Earnings calls follow a standard format where certain participants (investors or equity analysts) will ask questions about the health of the business, and either the CEO or the CFO of that business will answer those questions.
In addition to the transcript of the discussion, each document contains some basic information such as the company name, the company ticker, the date of the earnings call, the financial quarter, the stock price, and more. We’ve gathered ~100 of these transcripts for this example.
Let’s now perform some research over this dataset!
Run and inspect the sample code
Navigate to this Colab notebook, which contains the code for this example. In order to execute this notebook successfully, you’ll need an Aryn API key which you can get from the Aryn UI. (If you don't have an account, you can sign up for free here). In your account, you will load the dataset into Aryn, and then query it. Add your Aryn key to the Colab notebook, and enable it so the notebook can use it.
The first two cells downloads the SDKs that are required and configures the Aryn API key that the notebook will need. You may need to restart the notebook if prompted (to reload numpy), and pip errors are expected.
Now let’s focus on the following cell:
!wget -P materialize 'https://aryn-public.s3.us-east-1.amazonaws.com/haystack_documents/docset-before-ingestion.tar.gz'
!cd materialize && tar -xvzf 'docset-before-ingestion.tar.gz'
Here, we are downloading a version of the earnings transcript dataset that was already prepared using a Sycamore ETL script. The data was parsed, metadata was extracted (e.g. stock ticker name), and post-processing was done to identify the speaker for each passage. To learn more about preparing unstructured data for analytics, check out Part 1 of the full tutorial series mentioned above.
The next cell creates an Aryn client, reads the downloaded files, and writes them to the Aryn platform as a “DocSet,” or a collection of documents. The DocSet is an important concept in the Aryn system, as the abstraction also holds document chunks, metadata, and the lineage between the parts. If you want to learn more about DocSets, check out the larger tutorial series (we go into it deeply).
# Create the docset target in Aryn
aryn_client = Client()
aryn_docset = aryn_client.create_docset(name = "earnings-call-nb-0")
docset_id = aryn_docset.value.docset_id

# Write the data
(
    ctx.read.materialize(path = "materialize/materialize/docset-before-ingestion")
    .write.aryn(docset_id = docset_id)
)
This may take a couple of minutes, because you are creating and loading a DocSet in your Aryn account. Once it’s loaded, you can view the DocSet and the documents in the Aryn UI.
Now let’s focus on the final cell in the Colab notebook, which runs our analytics question: “In the past 5 years, which companies mentioned inflation the most in their earnings calls and how many times did each company mention inflation?”
# Imports and prep for the analytics
import unicodedata
import rich


# Read the data back and run analytics.
inflation_docs = (
    ctx.read.aryn(docset_id = docset_id)
    .explode()
    .filter(lambda doc: "parent_id" in doc)
    .filter(lambda doc: "inflation" in (unicodedata.normalize("NFKD", doc.text_representation) or "").lower())
    .groupby_count('properties.entity.company_name')
    .take_all()
)


inflation_table = rich.table.Table(title="inflation_mentions")
inflation_table.add_column("company")
inflation_table.add_column("mentions")

counts = [(d.properties['count'], d.properties['key']) for d in inflation_docs]
for c, k in sorted(counts):
    inflation_table.add_row(k, str(c))

rich.print(inflation_table)
Once you run this cell you’ll see the final output :
inflation_mentions
┏━━━━━━━━━━━━━━━━━━━━━━━━━━━━━━━━┳━━━━━━━━━━┓
┃ company                        ┃ mentions ┃
┡━━━━━━━━━━━━━━━━━━━━━━━━━━━━━━━━╇━━━━━━━━━━┩
│ Camden Property Trust          │ 1        │
│ Netflix                        │ 1        │
│ Tesla                          │ 1        │
│ Teva Pharmaceutical Industries │ 1        │
│ Intel                          │ 2        │
│ AstraZeneca Plc                │ 3        │
│ Nvidia                         │ 3        │
│ Amazon.com                     │ 4        │
└────────────────────────────────┴──────────┘
Cool - you did it! But, how did Aryn formulate the answer, and what did this code snippet do? Read on to find out!
A closer look into analytics on documents
Let’s focus on this last cell, and specifically the code snippet below which is doing the actual analytics query to answer the question:
inflation_docs = (
    ctx.read.aryn(docset_id = docset_id)
    .explode()
    .filter(lambda doc: "parent_id" in doc)
    .filter(lambda doc: "inflation" in (unicodedata.normalize("NFKD", doc.text_representation) or "").lower())
    .groupby_count('properties.entity.company_name')
    .take_all()
)
Here’s an illustration of the operations expressed in the code above:
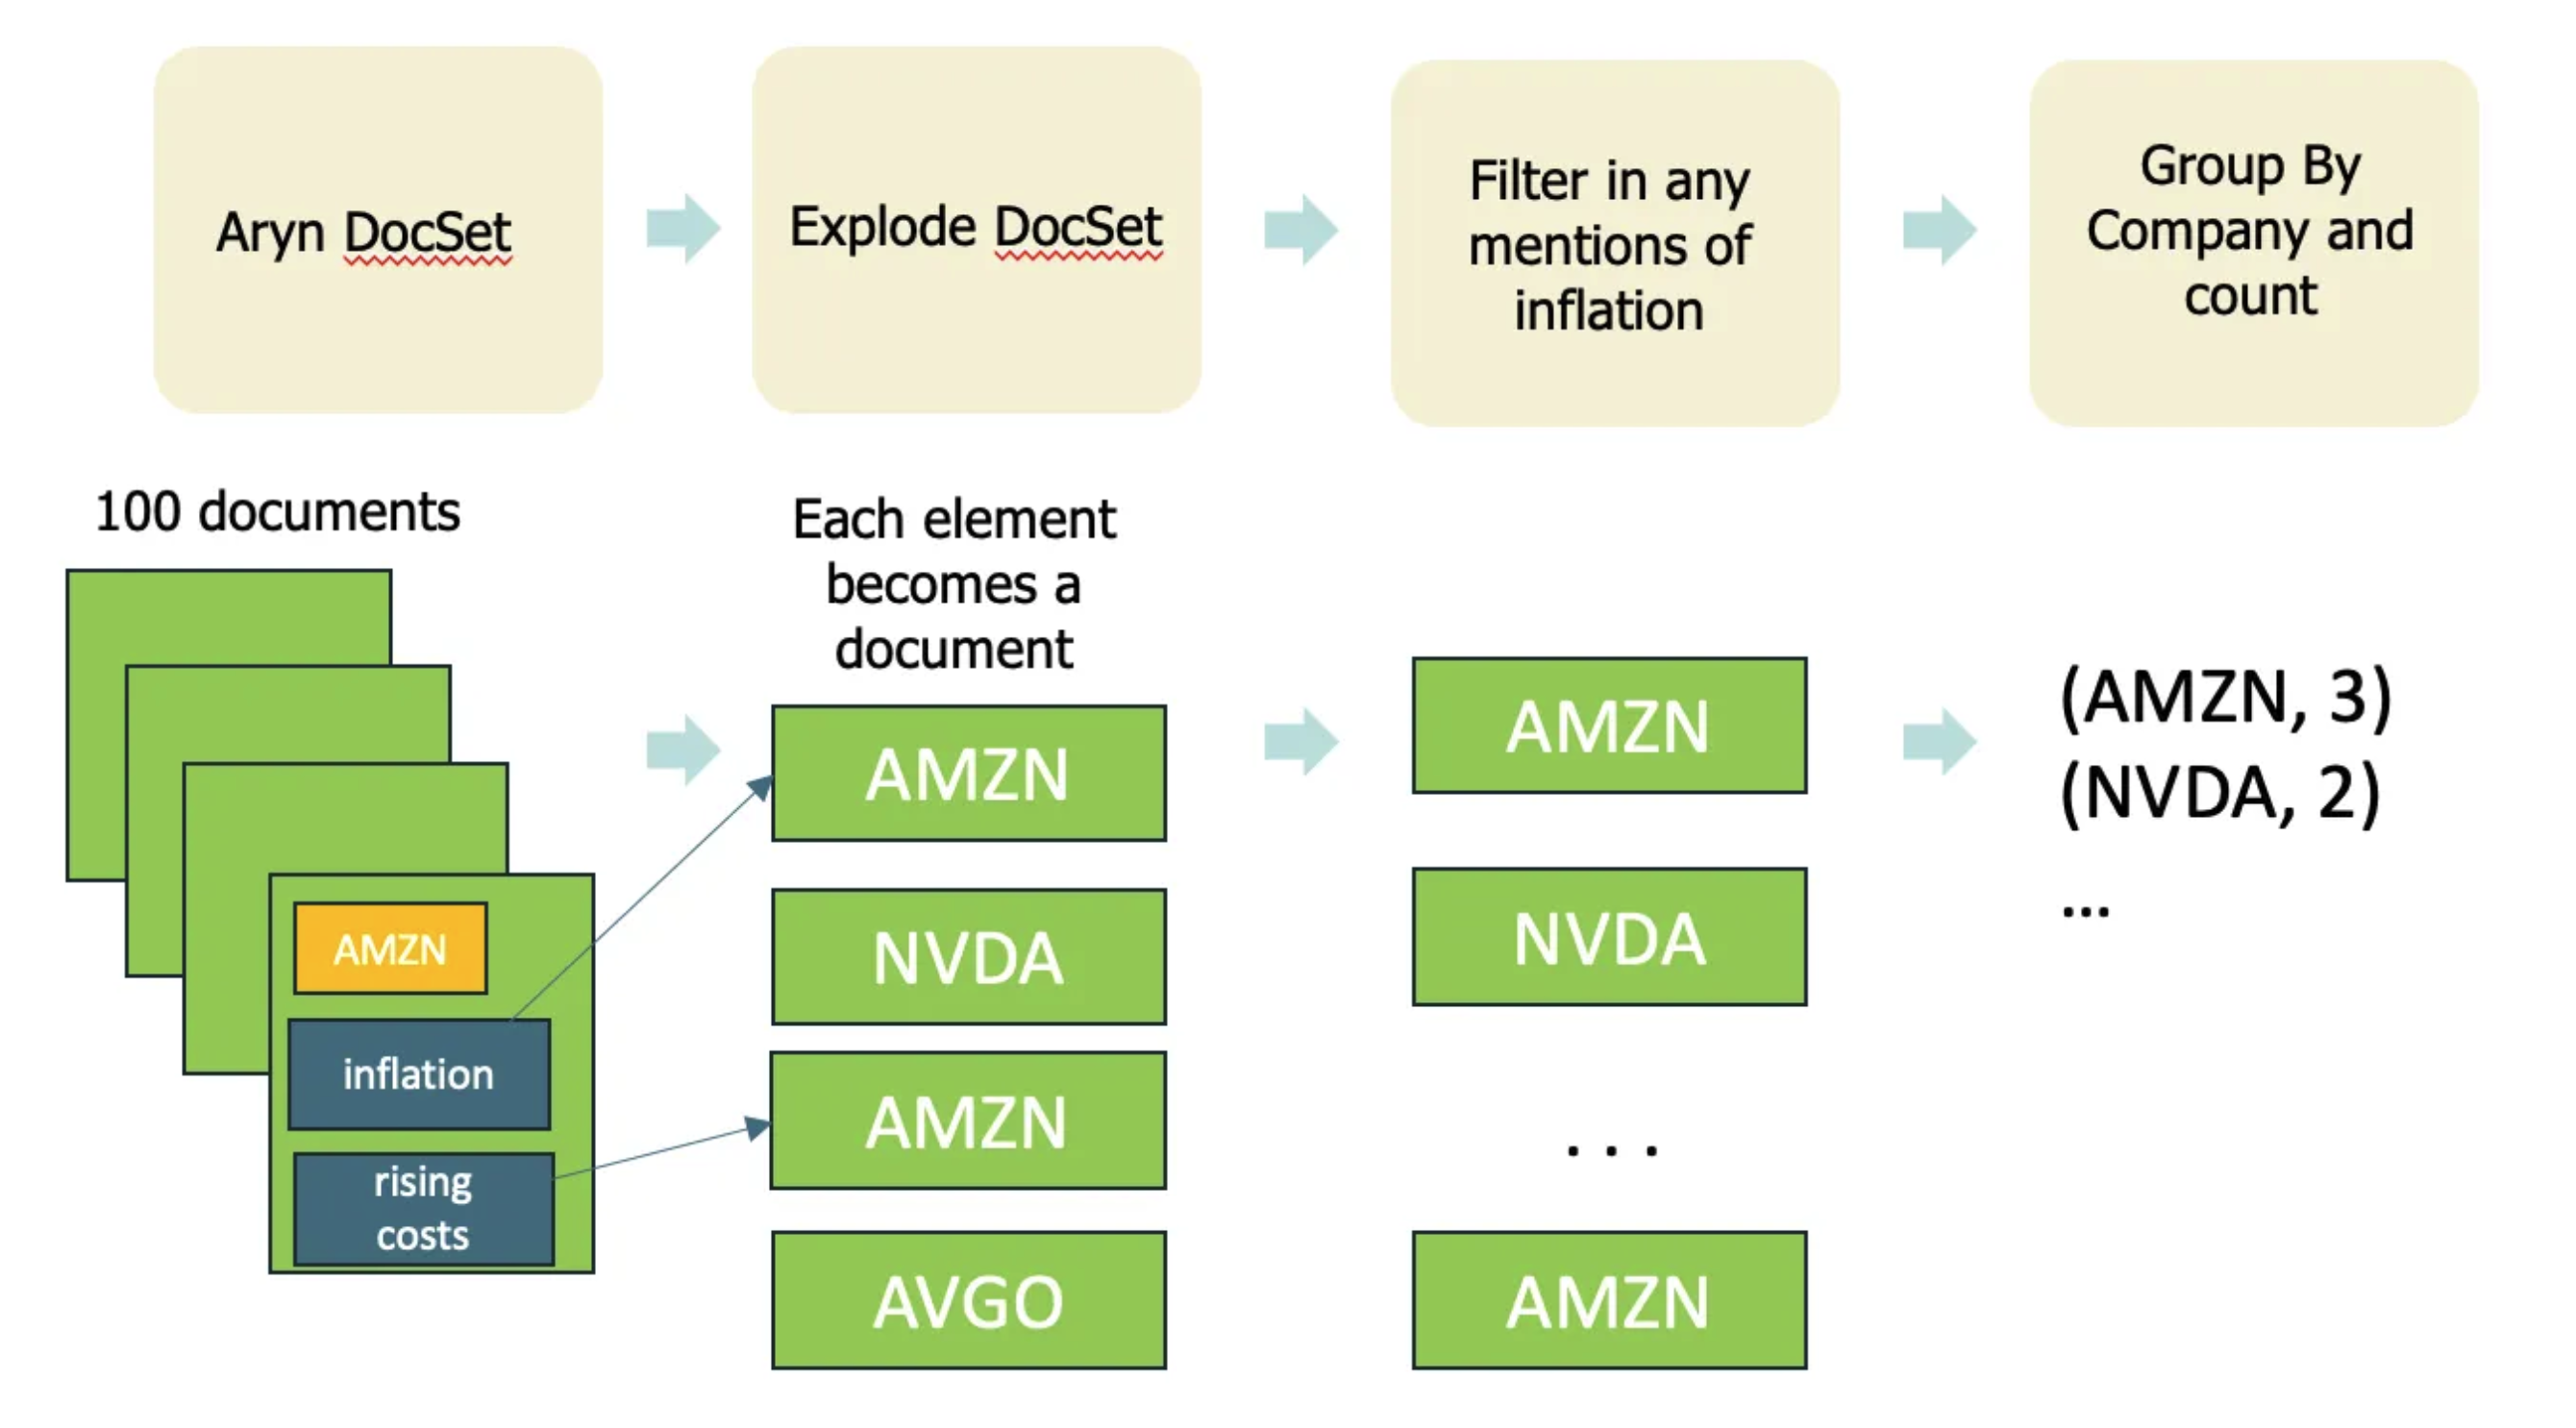
We’ve written our query in a few steps, using Sycamore:
- Read the DocSet from Aryn and explode it (explode flattens the hierarchy of a document)
- Filter each document and keep the ones where “inflation” is mentioned
- Group the mentions by company
We then include a take_all to run the query. The end result is a list of objects, where each object’s ‘key’ is the ‘company’ and each object also contains a ‘count’ for the number of times inflation shows up.
The code below then prints out the table with the result as the final output:
# Display the results
import rich
inflation_table = rich.table.Table(title="inflation_mentions")
inflation_table.add_column("company")
inflation_table.add_column("mentions")

counts = [(d.properties['count'], d.properties['key']) for d in inflation_docs]
for c, k in sorted(counts):
    inflation_table.add_row(k, str(c))

rich.print(inflation_table)
Next Steps
Congrats - you’ve just run a complex analytics query on a collection PDFs! This technique unlocks a ton of value from your document sets, as you can now sift through and analyze them at scale (versus needing to read all of the documents to get an answer!).
To learn how to prepare and run analytics on your own documents, we recommend jumping into our more detailed tutorial.
Tutorial sections:
- Part 1: Preparing documents for analytics (notebook)
- Part 2: Running RAG pipelines and exploring RAG limitations (notebook)
- Part 3: Running analytics on documents (notebook)
As a reminder, these run in Colab, and you’ll need an OpenAI key (tutorial will run ~$10 of OpenAI cost).
Also, join our Slack community to ask any questions or if you need help running analytics with Sycamore and Aryn!